ChatGPT
 Perplexity
 Claude
 Grok
Grok

We live in a digital world that is becoming more connected every day. This networked world is becoming more connected thanks to AI, Machine Learning and data science are increasingly driven by data. As a data analyst, you have your finger on the pulse of the times and can positively influence economic and social developments through a good analytical understanding.
It's a job that comes with a lot of responsibility. Because wherever data is used, it must be handled with great care. It is therefore not surprising that numerous well-known companies are vying for good data analyst candidates. We'll show you how you can become a data analyst as a career changer, for example by retraining, what you need to do so and what exciting opportunities this profession, which is being hailed as the hottest job of the decade, offers you on a daily basis.
And best of all: thanks to education voucher you can even receive further training free of charge under certain conditions. Since 2025, employees in small and medium-sized companies have also been able to receive subsidized further training via the Qualification Opportunity Act not just jobseekers. This means that more people are eligible for funding to train as data analysts.
How a data analyst works
The Data Analysis is a process in which insights are gained from disorganized information (data). Data can take many different forms. For example, vacation pictures and language files are just as much data as a first name and a phone number. By systematically examining this data for patterns and relationships, data analysts try to draw useful insights from this data and communicate them to others in an understandable way.
The work of a data analyst begins with so-called raw data. Raw data is initially unordered. As long as they are not cleaned up first, the data analyst cannot derive any insights from them. In other words, order must first be brought into the chaos in order to make data usable. That is the job of a data analyst.
Collecting, cleaning and organizing data is a major part of data analysis. To do this, data analysts use various methods from statistics, programming and visualization. However, data analysts don't have to be one hundred percent proficient in these disciplines, because many of these steps have now been automated and run partly on their own. You just need to understand these processes well in order to manage them and control the results.
Why you are in such demand as a data analyst
Data analysis is important for two reasons: firstly, it facilitates decision-making, and secondly, it makes decisions verifiable on the basis of facts. This is what makes it so valuable for companies that need to incorporate lots of different data in order to align their strategy wisely.
So instead of just relying on your gut feeling, as a data analyst you make decisions based on facts. Even if data analysis is not always 100 percent correct, it is the best tool for predicting trends and developments.
In practice, it can indicate future sales figures and helps with product development and sales strategy. However, it does not have to be used only in the economic sense. There are also data analyses in the health sector, agriculture or in the government apparatus.

Difference between data analyst and data scientist
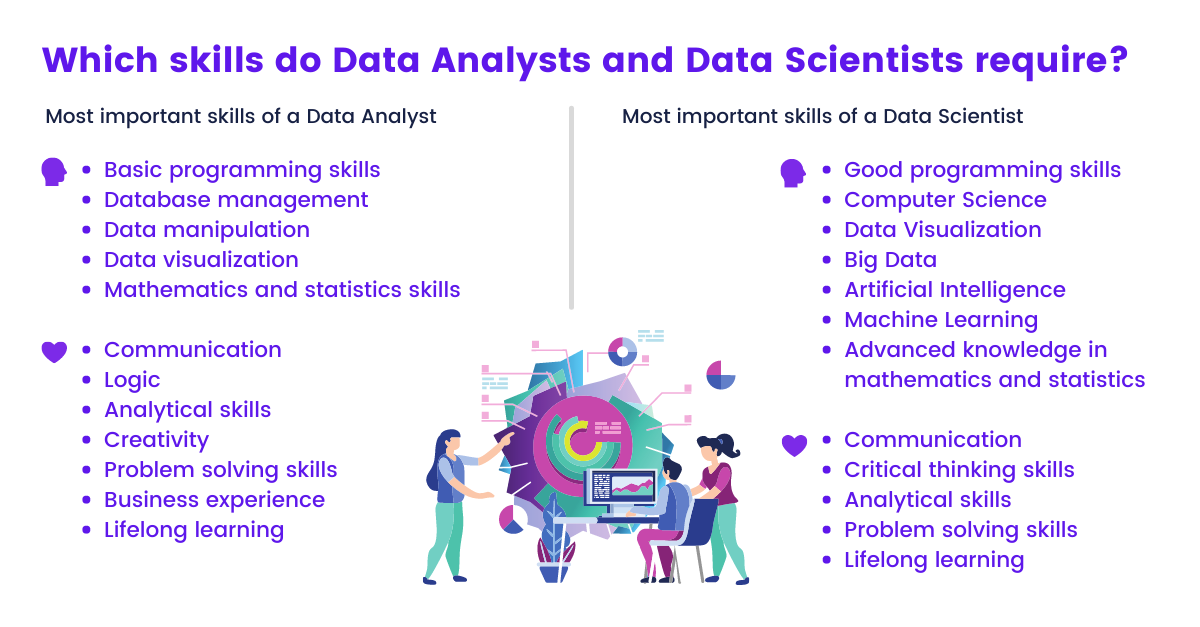
Often the Differentiation The distinction between the two job roles is blurred, as the professional field of data science is still relatively young and is constantly evolving. Data scientists differ from data analysts primarily in terms of their advanced professional skills.
Both roles share many similar tasks and are equally qualified to analyze and interpret data, but in addition, the data scientist has in-depth knowledge of programming and mathematical modeling. This enables the data scientist to tackle in-depth problems, such as the Automation of processes and the programming of artificial intelligence.
The data analyst takes on the role of a contractor and manages tasks defined by other specialist departments. The data scientist, on the other hand, independently looks for opportunities for improvement.

Become an expert in the use of AI tools with the AI specialist training and learn everything from AI basics to practical automation of tasks in order to impress on the job market with practical AI skills.

Enter the world of data and AI with the Data and AI Specialist training program: you combine practical Excel data work, modern AI tools and productive collaboration with MS Copilot.

Become the driving force behind AI strategy and AI transformation in your company with the Strategic AI Management training course. You will learn how to identify AI potential, evaluate use cases economically, introduce AI responsibly and lead your team through the change.

Become a bridge between IT, data and business with the Technical Project Manager course. Combine modern project management with Python basics, data and AI skills and reporting in Power BI - and steer technical projects to success with confidence.

Become a key figure for data and AI-driven projects with the Project Manager - Focus on Data & AI course. You combine modern project management with in-depth data expertise, AI know-how and reporting skills.

Become a driving force for data- and AI-driven transformation in your company. You combine AI and data expertise with business analysis, change management and modern reporting skills.
Further training
Data Analyst tasks: You will be responsible for these activities
Put simply, a data analyst collects and prepares a large amount of data and then performs analysis on those data sets. As a Data Analyst, you look for ways to harness data to gain insights, answer questions, and solve problems. The analyses a Data Analyst creates should lead to better, more informed business decisions.
With the results, a company can reduce production costs, increase customer satisfaction or solve other problems that cost the company money. The data analyst works in a team with data scientists and data engineers.
1. formulate the question
Your analysis starts with the definition of what you want to find out. The results of a data analysis are only as good as the question with which the analysis was started. To formulate the right question, you need to define the goal of the analysis. In a way, it is the most important part of the analysis process.
The crux of the matter is that the obvious problem often does not lead to the core of the solution. Albert Einstein once said, "Problems can never be solved with the same mindset that created them." It is therefore important to first look at a problem from different perspectives and to have a basic understanding of the needs and requirements of a company.
2. collect data
Once you have identified the right question, you need to determine what data you need to answer it. Two scientific approaches help you here: quantitative and qualitative analysis. Quantitative analysis is about large amounts of data, while qualitative analysis is about getting the most meaningful feedback possible, such as customer reviews. To do this, data analysts use three different data sources:
- First-party datathat are collected directly from you or your company
- Second-party datathat come from another company
- Third-party datathat come from other sources such as social media
3. clean up data
The raw data that you have now are not yet sorted, have not been brought into a uniform format or are partially incomplete. To prepare them for data analysis, you must first bring them into a uniform state. First you look for errors, duplications, outliers and placeholders and eliminate them. Then you check again whether the data now meets your requirements or whether you need to review it again. Data analysts also refer to this procedure as data wrangling.
4. analyze data
Once you have cleaned your data set, it is ready for analysis. Here, data analysts have several options at their disposal and you have to decide which approach is best suited for the respective question:
- The descriptive analysis summarizes characteristics of a data set and attempts to describe them. While it does not allow for definite conclusions, it is very useful in determining which next analysis steps are appropriate.
- The diagnostic analysis is designed to understand causes and relationships. Examining the relationship of two values, can help identify problems. This step also helps to review your own question and adjust it if necessary.
- The predictive analysis helps to read trends and developments based on past data.
- The prescriptive analysis can be useful in deciding how to proceed and is also used as a machine learning technique when computers are to learn to make predictions on their own.
5. visualize and communicate data
Once you have applied the analysis techniques to the data, there is one last important step. You still need to communicate the results of your analysis and explain them clearly to others who do not have the same or even any analytical skills. To do this, you visualize the data and create suitable charts, graphs, presentations, reports or interactive dashboards that visually underline your findings.
This step is very important and has the goal that everyone can immediately interpret the results correctly at a glance and understand them themselves so that they can put them into their own words. If the visualization is simple and unambiguous, it is of high value for further decision making.
How do I become a data analyst? You really need these 11 skills
A career in data analytics can require a wide variety of skills, including technical and non-technical ones. This also includes the concrete application of Data Analyst Tools. The skills required depend entirely on the company, the industry and the exact role. Nevertheless, let's take a look at the most important and most common nine qualifications that are important for your entry as a data analyst.
Become a data analyst: Technical skills
1. programming skills
Most of the time, a job as a data analyst requires, above all, the collection, preparation and analysis of data. In addition, programming skills are an advantage in order to be more flexible and independent of analysis software. This can save time in the day-to-day job. Python skills in particular are in high demand. Because of all the programming languages that exist, Python is the preferred one. If you don't have any previous knowledge, that's not a big deal. Even as a complete beginner, Python skills can be learned relatively easily with an in-service training.
2. databases and their languages
The management of data requires an understanding of the respective language of a database. A database comes into play where the capacity of Excel ends. It is a system in which very large amounts of data are stored and retrieved. A data analyst must be able to recognize the structures of databases in order to collect the information needed for an analysis.
3. data manipulation
In very few cases is the data ready for analysis from the start. As already mentioned at the beginning, data are often incomplete, not sorted or are available in different formats. Data sets must therefore first be cleaned. Analysts often use a language such as Python to prepare data for analysis. This process is called data manipulation.
4. tools for data visualization
What does a data analyst do with the results of their analysis? Data visualization is a powerful skill for communicating results. Tools such as Matplotlib, JavaScript d3.js and Tableau. Mastering these tools is important, but it is even more important to understand the principles of how data can be successfully visualized and communicated in an understandable way using data storytelling.
5. mathematics and statistics
Statistics and linear algebra are skills that a data analyst should have or learn. They are crucial when it comes to performing tests and, in very advanced cases, also necessary to decide how algorithms can be optimized. For the second case, programming knowledge in Python often already offers great assistance.
6 AI competence
Since our last update of this article in 2024, the use of AI tools in data analysis has increased significantly. Systems such as ChatGPT, Gemini and Copilot support analysts in data cleansing, reporting and visualization. This means that data analysts don't have to be able to do less - but they are increasingly using automation and generative AI to speed up routine work.
7. cloud knowledge
Modern data landscapes are often stored in the cloud, e.g. on platforms such as AWS, Azure or Google Cloud. Knowledge of these platforms enables data analysts to efficiently store, retrieve and process large volumes of data. Cloud services also offer numerous automation and analysis tools, from scalable databases to machine learning frameworks. Those with cloud skills can perform analyses faster, optimize data pipelines and support teams that are increasingly relying on cloud-based data architectures - a decisive advantage in modern, data-driven companies.
Become a data analyst: Non-technical skills
8. logic
A bright mind will get you far. A useful skill for data analysts is to use logical thinking patterns that do not require higher mathematics. Often, a data analyst must be able to think well within the context of his or her analyses in order to set interesting questions and critically examine the results. Data analysis is a broad field with a variety of tasks.
Depending on the field of work, special knowledge is required. It is important to have a basic understanding of mathematics and statistics, but it is even more important to be able to look at problems in an analytical way. 80 percent of a data analyst's work consists of preparing, sorting and visualizing data, which usually does not require higher mathematics.
9. creativity
Data Storytelling and presentations go hand in hand. But strong presentation skills don’t come naturally. The ability to tell an engaging story with data is crucial for effectively communicating insights and captivating the audience. It is an art in itself to express complex relationships simply without distorting the content. For this reason, data visualization and effective data storytelling are essential skills that a data analyst must master.
10. social skills
It is important to understand who the customer of an analysis assignment or the target group of a presentation is and what prior knowledge these people have. This is especially true if the insights cannot be recognized easily and quickly. Often, other departments lack the knowledge to properly interpret the results of a data analysis. A data analyst knows what information his audience needs and how best to convey it.
11. business experience
Understanding what a company's goals are is critical when it comes to making informed, data-driven decisions. Data Analysts should not only understand how data can impact their company's decisions, but they should also know how to interact with engineers or product managers, for example, or have industry knowledge. Both a technical and non-technical understanding of the business and its internals is essential for the data analyst job.
What tools and programming languages do data analysts use?
Data analysts work daily with a wide range of software, programming languages, and modern AI-powered tools to collect, clean, analyze, and visualize data. While traditional applications such as Excel, SQL, and Python continue to play central roles, cloud platforms and AI-powered solutions will increasingly gain importance by 2026. The following table provides an overview of the most important tools, their areas of application, and their benefits in the day-to-day work of data analysts.
| Tool | Description |
|---|---|
| Microsoft Excel | Offers functions for data processing, sorting and presentation in diagrams. A good understanding is helpful for daily work as a data analyst. |
| SQL | Programming and database language for database management and querying large data sets. |
| Python | Popular, easy-to-learn programming language for data analysis, automation and visualization. Open source and flexibly customizable. |
| SAS | Software for advanced analytics, business intelligence, statistical modeling and big data management. |
| R | Programming language and software environment for statistical calculations and graphics creation. Open source, flexible and expandable. |
| ChatGPT / OpenAI API | AI-supported tools for faster data interpretation, code generation and automation of routine tasks. More time for strategic analysis. |
| Power BI Copilot | AI-supported automatic creation of dashboards and reports, interactive visualizations and faster trend analysis. |
| Snowflake & Databricks | Cloud platforms for centralized management of large amounts of data, scalable storage solutions, high-performance queries and integrated analysis tools. |
| Looker Studio (Google) | Tool for interactive dashboards and reports, especially for marketing, sales and web data. Easy integration into Google products. |
Retraining as a data analyst: your path to a new career
Your career as a data analyst starts with learning job-relevant skills. As a newcomer with no mathematical or programming background, this means first and foremost familiarizing yourself with the basics and understanding the analysis process. Once you have acquired the most important skills, you can think about applying for a job as a data analyst.
Even if this process sounds effortless, such a career change requires a lot of personal commitment. To learn everything you need for this change and to draw on the expertise of experienced data experts, it is worth considering online courses for your retraining as a data analyst.
Upon successful completion, such a course can mean certification as a data analyst, which is an important alternative to the classic university degree. To take the first step on your new career path, you can find out about course offerings and funding opportunities through the Federal Employment Agency or the Job Center at StackFuel.
Everyday work as a data analyst: practical example
The Day-to-Day Work of Data Analysts It depends entirely on the industry or the company. You may be responsible for creating dashboards, maintaining databases, and conducting analyses for various departments within the company. Most of them work closely with IT teams, management, business units, and data scientists.
Depending on the task, the knowledge and tools a data analyst works with vary. Some Data Analysts don't even use programming languages and work mainly with statistical software and Excel. Because the field of data analysis is so diverse, a Data Analyst may spend the morning, for example, cleaning data and the afternoon creating concrete, customized solutions. Let's try to outline a possible day in the life of a Data Analyst.
In the morning, Data Analyst Lisa uses SQL to retrieve data from a database and then analyze it. To do this, she works in a table with customer data such as name, age, postal code and value of goods. Lisa wants to find out where customers shop most frequently, but there are many data gaps in the table, so she discusses with her manager how to deal with the gaps. The manager decides that she needs to coordinate with different groups of people or stakeholders.
She must discuss with IT how the data gaps arose so that they can be eliminated afterwards. With her contact from the business department that commissioned the analysis, she needs to agree on how to deal with the data gaps. They decide to use artificial intelligence and machine learning to fill in the gaps. To do this, Lisa continues to work with an expert on her team.
Later that day, Lisa works on visualizing the results of her latest analysis and turning them into a presentation to present to her team in order to jointly determine the next steps. In doing so, Lisa places particular emphasis on ensuring that the presentation of the results is coherent and easy to understand in order to simplify a decision.
The many job opportunities for data analysts
An indispensable basis is, of course, that a company operates digitally. The more digitally oriented the company, the more data it has at its disposal. Classically, data experts are therefore urgently sought especially in the finance, insurance, online retail, energy, telecommunications and healthcare sectors.
There are also different specializations among data analysts, such as financial, marketing, weather or risk analysts. Although these job profiles have different names, they are so similar in terms of their tasks that a Certification as a Data Analyst you are sufficiently qualified for these and other analyst jobs. This is not only particularly future-proof, but also makes the skills of a data analyst among the most sought-after of the 21st century.
In many areas of business and society, it is very important to actively evaluate data. Only in this way can companies gain important insights into their products, services, customers and even internal company processes and how they can be improved. In this way, they can gradually gain competitive advantages and overtake the competition. Data analysts are also in demand in socially relevant industries. The healthcare industry needs to analyze and evaluate patient data in order to obtain information about the best treatment options and develop healthcare products.
So the opportunities for Data Analysts are endless and career changers can even stay in the industry they know if they want to.
Data Analyst Salary in 2026: Here's How Much You Can Earn
The demand for data analysts remains high - and salaries are also consistently attractive.
| Experience level | Source & reference | Value |
|---|---|---|
| Entry / "Junior Data Analyst" | StepStone: "Junior Data Analyst" - average salary approx. 41,800 €/year. StepStone | approx. 41,800 €/year |
| Entry / average | Kununu: "Data Analyst" <3 years of experience - average 52,200 €/year. Kununu | approx. 52,200 €/year |
| General mean value | StepStone "Data analysis employee": average approx. 47,400 €/year, range from min ~40,100 to max ~57,000 €. StepStone | approx. 47,400 €/year |
| Senior & with experience | Glassdoor: "Senior Data Analyst" - typical area ≈ 74,000-86,000 €/year according to user information. Glassdoor | approx. 74,000-86,000 €/year |
| General (all experience levels) | gehaltsvergleich.com: Data Analyst Ø salary approx. 4,782 €/monthso ~57,400 €/year. Salary comparison | ~57,400 €/year |
Job market
- According to a Overview of StepStone for example, there are around 5,299 vacancies for "Data Analytics" in Germany (as of 10/2025).
- For "Data Analyst" jobs in individual regions, StepStone shows, for example 614 open ads in Hamburg.
→ These figures make it clear: The market for data analysts is still large and growing.
Trends & special features
- Positions with more responsibility or leadership (e.g. Analytics Manager, Analytics Lead) achieve significantly higher remuneration - according to Glassdoor, for example 86.000 € resp. 93.000 € for manager roles.
- The use of AI, data platforms and big data means that data analyst roles are increasingly AI-related and with higher requirements - this increases demand and thus salary levels.
Conclusion
If you are serious about a career in data analysis, there are many ways to learn the skills presented in this article and become a data analyst. One of the most efficient ways to do this is through further training that prepares you for the challenges of the profession.
While many large companies are urgently trying to find and hire data experts on the job market, more and more companies are now investing in training their employees in the role of Data Analysts and Data Scientists. This is mainly because there is already a major skills shortage in this area and this is expected to increase. An additional advantage is that such employees already have invaluable experience in the industry, the market and the internals of the company.