ChatGPT
 Perplexity
 Claude
 Grok
Grok

If "big" is still an understatement. If you want to understand big data, you need to understand one thing above all: 90 percent of existing data has only been created in the last two years. Since we have been creating virtual data, the amount of data produced every day has been growing exponentially.
Over 2.5 trillion bytes of data are produced worldwide every day. If one gigabyte were equivalent to one kilogram, the daily data volume would be roughly 350 times the weight of the Eiffel Tower. Emails, documents, social media posts and photos - whether professional or private - this truly unimaginable amount of data is what we call big data.
What is big data? And what is an example of big data? If you've ever wondered this, you've come to the right place. We'll tell you what's behind this term and how you can discover real data treasures with large amounts of data.
When do we speak of Big Data?
Where is the boundary between big data and big data? Data is obtained from a wide variety of sources as a result of ongoing digitization. There is text data from work emails, images from your social media feed, medical data from test series, sensor data from production facilities or video recordings, to name just a few examples.
The formats and structures of this data are heterogeneous. This means that data is not all the same or can be treated the same way. Image files alone can come as GIF, PNG, JPEG, TIFF or BMP. Texts as RTF, DOCX, TXT or PDF.

The question of what exactly big data is can best be explained and easily remembered using the three "Vs":
- Volume (Volume)
- Variety (Variety)
- Velocity; also speed (velocity)
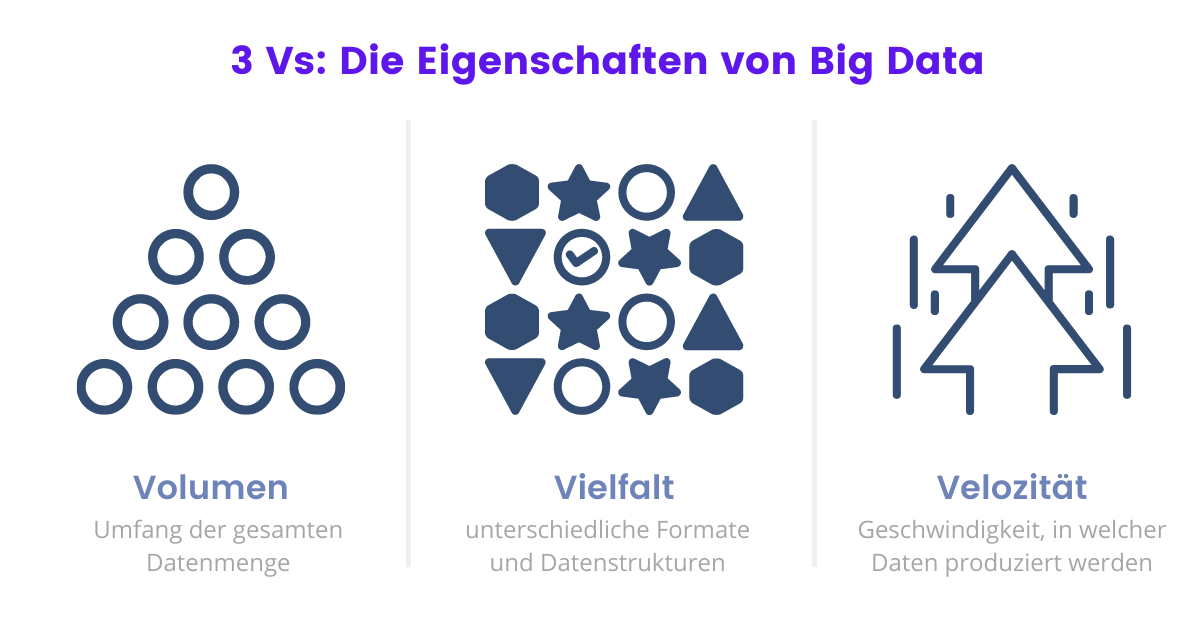
Let's explain the volume first. The amount of data produced every day is constantly increasing, and with it the volume of the total amount of data. In addition to the data that a company produces itself, data is also increasingly flowing in from outside.
The different formats and data sources lead to a heterogeneity (variety) of data structures. Just one fifth (20 percent) of the data is available as easy-to-process, so-called structured data. The remaining 80 percent is unstructured data that is difficult to process.
As the number of people and devices generating data increases, so does the velocity at which it is produced. In 2025 75 percent of the world's population will be connected to the Internet. It is estimated that around 20 percent of the total data volume will then be real-time data.
Real-time data, also called real-time data, is data that is processed directly after it has been recorded. The best-known example of this is the stock market, where seconds determine losses or profits.
Companies are increasingly facing challenges arising from the processing and analysis of Big Data. Large amounts of data require a lot of storage space and also a lot of computing capacity. The variety of formats must be merged and standardized so that they can be processed. These requirements exceed the capacities of conventional technologies and methods, such as classic databases or reporting solutions.
What is Big Data technology?
In order to filter, examine and query the data volumes, specific Big Data technologies and Big Data Analytics-methods are used. With powerful IT solutions and systems, they form an interplay of various innovative technologies that are applied depending on the scope and type of data.
Here, one often stumbles upon the term data mining. These are statistical-mathematical methods that are used to recognize patterns in data sets. Based on existing data, algorithms can identify regularities and trends. Business intelligence solutions, on the other hand, support the process of systematically collecting, evaluating and presenting data in order to optimize the value chain.
The purpose of any Big Data technology is to transform data into useful information in order to derive new knowledge from it. The more data that is included in the method, the more accurate the derived knowledge.
The aim of developing big data technologies is therefore to develop cost-efficient and fast forms of data processing. Big data analytics can be used to generate new insights and valuable knowledge in real time. This facilitates decision-making and promotes the automation of processes.
To the free Microlesson "Big Data & Data Analytics".
Example of big data in practice: Why is data so valuable?
The world of data is changing. Companies with digital products in particular have to adapt to it on an ongoing basis. In many industries, data is becoming a differentiating factor that determines the success or failure of market launches, production processes and strategic decisions.
The relevance and also the need for companies to be able to process large amounts of data quickly and in a targeted manner is increasing rapidly. The targeted use of big data offers the opportunity to improve existing products and processes on the one hand and to open up new business areas and support the development of new business models on the other.
Examples of big data in marketing
In practice, these potentials can be used across all business sectors and departments in the company. In order to offer a unique and individual range of products and services, customer data such as interests, gender or behavior are analyzed in marketing. With the help of Big Data technologies, patterns in buying behavior can be identified. Specific marketing and sales measures can be used for cross-selling or to counteract customer churn with a targeted discount campaign.
Examples of big data in production
We can also find examples of big data applications in production and manufacturing. The sensors in factory and industrial plants serve as an interface to the outside world and usually transmit data on the status of the plant and the production process every second. This means that faults and failures can be predicted at an early stage on the basis of sensor data and long downtimes can be prevented.
Examples of big data in logistics
Complex structures such as supply chains in logistics can also benefit from the use of big data. With the efficient evaluation of data on warehousing, demand and sales planning, as well as transport routes, reliable forecasts can be created for distribution and logistics networks in order to avoid supply bottlenecks, for example. In addition, predictive planning can reduce transport costs or, with the help of position data, transport routes can be adjusted in real time.
Examples of big data in finance
Due to the large amount of available figures and data, the financial sector also offers a good basis for exploiting the opportunities offered by big data. Particularly in risk management, forecasts can be derived and scenarios formed on the basis of available data. This makes it easy to react quickly to risk factors and market developments.
What is Big Data, simply explained? - Conclusion
The scale of big data is so enormous that it cannot be handled by conventional data processing software. Nevertheless, it is important to recognize and exploit the potential of big data.
The potential of Big Data and the use of targeted technologies can be summarized in many ways:
- Strengthening customer orientation and loyalty
- Increase profitability and optimize processes
- Calculating and minimizing risks
- Increase profit and reduce costs
If you now also want to discover the data treasures of your company and make Big Data usable together with your team, we will gladly support you with a free consultation. We help you to use the potential of digital transformation to your advantage.
Sources
PWC: "Big data: significance, benefits, added value" [05.07.2022]
BigData Insider: "Global data volume will increase tenfold to 163 Zbyte by 2025" [05.07.2022]