ChatGPT
 Perplexity
 Claude
 Grok
Grok

Power BI and Tableau are the two most important self-service BI tools in the current business intelligence landscape. Both tools have their advantages and disadvantages. Although at first glance both BI tools are used for exactly the same purpose, there are minor but relevant differences for their application purposes. In this article, we will compare the two main BI tools. So, let's find out below which of these tools is best suited for which application purpose.
What is Power BI?
With Microsoft Power BI, business data can be analyzed in the shortest possible time. The insights gained from the data can be presented in reports or dashboards with just a few clicks. Power Query is directly integrated into Power BI and enables rapid processing of the data. Conveniently, Power BI can be seamlessly integrated into any Microsoft tool and extended by numerous add-ons.
What is Tableau?
With Tableau, data can also be analyzed in a very short time. The findings are then visualized in interactive dashboards. Data cleansing is performed externally in Tableau via the ETL tool Tableau-Prep. Because Tableau was bought by the cloud computing company Salesforce, many integrations with Salesforce applications are possible.

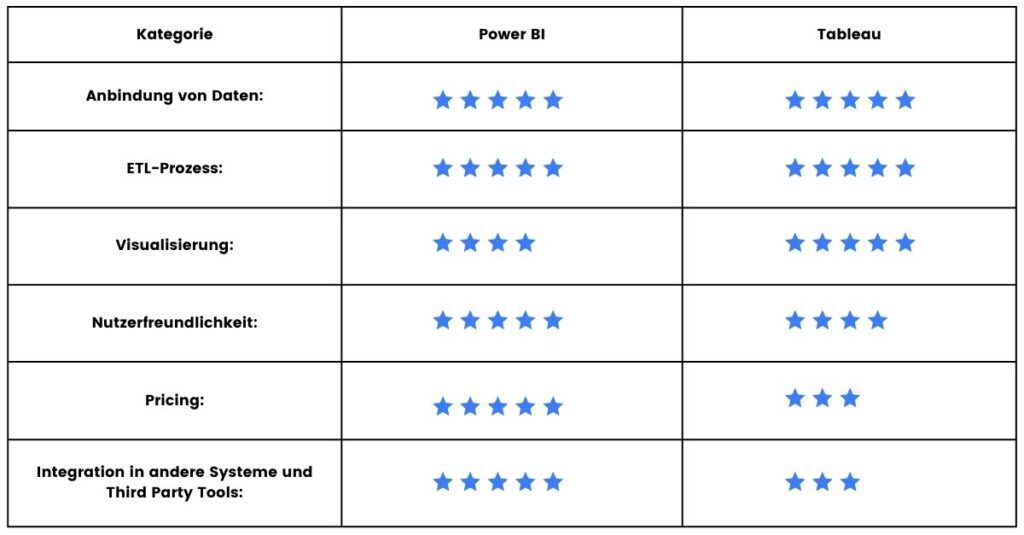
Power BI vs. Tableau: The connection of data
Data exists in many different formats and must therefore first be prepared for analysis and connected to the corresponding BI tool. For this important step, interfaces must exist that enable the connection and processing of the corresponding data formats.
When it comes to connecting data, the two BI tools don't have much in common. Both have the necessary interfaces to access the most common data sources. Both Tableau and Power BI can access on-premise (locally hosted) and cloud data sources.
The ETL process of Power BI and Tableau in comparison
An ETL process (Extract, Transform, Load) refers to the process in which data is extracted from various sources, converted into a uniform format (the format of the target database). To complete the ETL process, the data is then transferred to a database or data warehouse.
Power BI's ETL tool, Power Query, is directly integrated with Power BI. This allows users to extract data from various sources, transform it and cleanse it for errors, duplicates, etc. using built-in standard functions. All ETL processes run in the background in Power BI via M. More complex transformations can also be performed directly using the M and DAX formula languages.
Unlike Power Query, Tableau Prep, Tableau's ETL tool is not integrated into the desktop version Tableau and is included exclusively in the Creator version. Tableau Prep offers basically the same functions as Power Query. Data can be extracted, transformed, cleaned and loaded using standard functions. For more complex transformations, Tableau uses its own formula language.
Power BI vs. Tableau: Data visualization in just a few steps
Both BI tools offer a variety of options for visualizing data. Loading data in Power BI works very simply via the navigator. When data is integrated, numerous visualization options are available.

Power BI's Q&A feature allows users to continue to explore data sets using natural language. Power BI's graphs are clear and intuitive, allowing users to quickly gain insight. Up to 3,500 data points can be included simultaneously for visualization.
In Tableau, any number of data points can be included for visualizations. As with Power BI, data can be visualized without programming knowledge. Although Tableau is also suitable for visual data analysis, Tableau focuses more on exploratory data analysis.
A comparison of the user-friendliness of the two self-service BI tools
Usability is one of the most important decision points when introducing new software. In both Power BI and Tableau, data can be loaded easily via the navigator. Both BI tools have a clear and comprehensible user interface. Guided navigation makes it easier to get started with both tools. However, Power BI could be more intuitive at the beginning, especially for career changers who have already worked with other Microsoft programs, and enable an easier start.
Integration with other systems and third-party tools
To get the most out of BI software, integration with other systems is essential. Since Power BI is part of Microsoft, Power can be seamlessly integrated with most Microsoft systems. For example, services such as Microsoft Office, Azure, Teams and Sharepoint all have interfaces that allow Power BI functions to be easily integrated. Power BI also has numerous third-party programs that can be used to extend the basic Power BI functions.
Tableau does not allow seamless integration like Power BI does. Here, a connection to common systems must be established in a complicated way. With the acquisition of Tableau by Salesforce, Tableau can at least be used seamlessly with Salesforce services. However, Tableau hardly has any third-party programs with which Tableau could be extended.
Cost comparison of Power BI and Tableau: Which BI tool is cheaper?
The desktop and web version of Power BI can be used free of charge. However, Power BI Pro is required to share content. Power BI has three different pricing models. The Pro version, for €8.40 per month, allows users to analyze and visualize data and share the dashboards they create with the entire company. To gain access to all Power BI features, such as Microsoft's artificial intelligence or the self-service Big Data function, a Premium license is required for €16.90 per user.
Tableau also offers three different cost models. The Viewer for 15 € per month can only access published dashboards. The Explorer for €42 per month gives users access to all published dashboards and allows them to create their own workbooks. The Creator for 70 € per month has full access to all Tableau functions such as TableauPrep and all other functions necessary to create dashboards.
Conclusion
Both tools offer advantages to users when it comes to connecting and visualizing data. However, if the focus is on acquiring a BI tool that is inexpensive to implement and can be integrated into existing systems without much effort, then Power BI is the tool of choice.
The somewhat easier entry thanks to the similarities to other Microsoft services and the numerous available third-party programs also speak in favor of Power BI in many respects. If you are interested in detailed explorative data analyses, Tableau may also be the right choice for you.

Sources
Big Data Insider (2018) "What is ETL (Extract, Transform, Load)?“ [16.11.2018]
Amexus (2022) "Power BI vs. Tableau - A brief comparison of the giants" [04.05.2022]
OMR Reviews (2022) "Tableau or Power BI? A comparison of the two leading self-service BI tools“ [24.06.2022]
Braincourt (2021) "Power BI or Tableau? Self-Service BI Tools in Comparison“ [15.12.2021]